37 Stocks
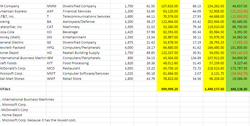
While completing this assignment I learned how to use certain equations to put the information in much easier then me doing out all the math then after typing it all into the computer. I just typed in equations in certain cells and it did the math also it added up all the numbers I need it to easily. Using this method with the equations has helped me out so much because I know all the math is right and it didn't take that much time. I think what I could have done to make this easier was type out all the information first then edit it all at once like you are supposed to do rather than doing little by little and taking a much longer time.
22 Excel
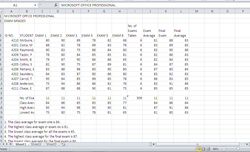
During this assignment I got the average of kids grades by using equations and adding up grades too. I used average equations and sum equations. This assignment, I definitely think this assignment helped me learn how to use the average and sum equation well. It made it so much easier to complete this document with the equations. I think maybe I could have read through and used all the directions instead of using the ways I already knew how to do certain things. It probably would make it easier and faster to complete.
Bar Charts group project
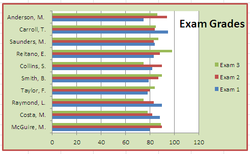
In this assignment we had groups. Our assignment was to research a specific topic; our topic was bar charts. We learned how to make them, edit them, and design them. Our next step was to teach the class what we had researched and learned over the last three classes. We decided to create a power point that explained all the aspects of bar charts. We presented it to the class then handed out a worksheet to see what they learned from our presentation. They all seemed to do well on the activity that was made for them so I think we did well on teaching the class about bar charts. To do this assignment we used different programs on computers. By accomplishing this work I learned how to make a bar chart and change the designs to make it look more appealing. Next time to improve my work I will maybe do a different job in the project take a different part that maybe I'm better at and practice my presentation more times.
Power Point - Bar Charts
This is the power point that my group did.
50 Yacht Mortgage
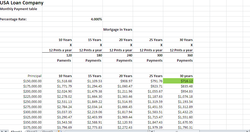
During this assignment I learned how to calculate the mortgage of loans with different amount of years. For this assignment we had to use calculations and a tool called auto fill. It made everything so much easier to use this because we didn't have to type out the equation into every cell to calculate the monthly mortgage. I learned how to use the Payment function. It allowed us to calculate the mortgages much easier. I created the spreadsheet well and used the auto fill function well. I could take less time to complete my assignments next time.
